














How Technology Assists in Assessing Road Accident Aftermath Scenes
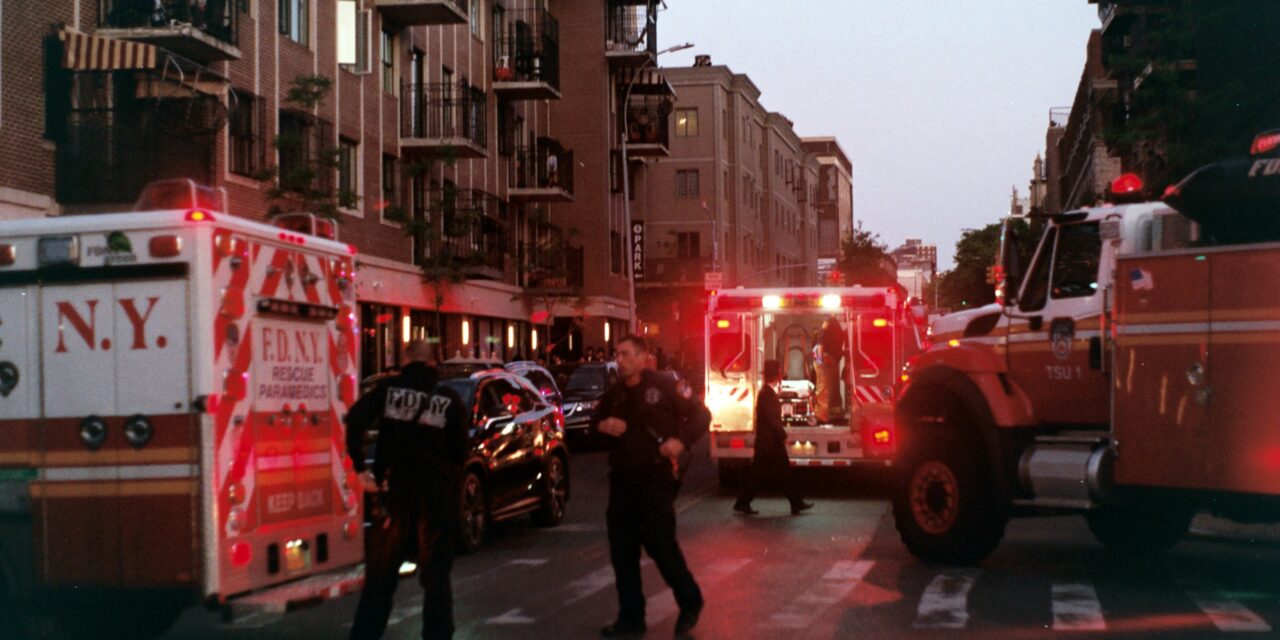
Accident scenes change fast. Fresh skid marks fade, weather shifts, and traffic resumes. Today, investigators lean on a toolkit of technologies to lock in what happened – quickly, safely, and with high accuracy.
These tools do more than speed things up. They help teams capture precise measurements, sync timelines, and test theories. Used well, they turn a chaotic moment into a structured set of facts that can stand up in court.
What Investigators Need From A Scene
Every crash scene tells a story, but only if the details are collected before they vanish. Investigators need positions, angles, speeds, and driver inputs preserved in formats that can be measured and rechecked. The first goal is to freeze the scene in time – without keeping roads closed longer than necessary.
Safety matters too. Technology reduces the time people must stand in traffic lanes with tape measures. It also cuts down on human error by automating measurements and time stamps. That mix of speed and accuracy sets up better reconstructions later.
Core Documentation Goals
- Capture geometry of vehicles, roadway, and debris with measurable precision
- Record timing cues like light cycles, braking, and impact sequence
Preserve digital data in formats that can be verified and reproduced
Event Data Recorders And Vehicle Telemetry
Modern vehicles often store pre-crash and crash data in an event data recorder. These logs can include speed, brake status, throttle position, seat belt use, and airbag deployment. In fact, federal rules describe EDRs as devices that record time-series vehicle data just before and during a crash, intended for retrieval after the event, according to the Code of Federal Regulations.
Accessing EDR data requires the right cables, software, and permissions – and coordination with owners, insurers, or law enforcement. When a heavy truck is involved, a truck injury attorney in Texas may push for preservation letters early on to prevent any loss of evidence – this helps keep the data intact while experts arrange a proper download. The result is a set of numbers that can be matched against tire marks, collision damage, and witness accounts.
Handled correctly, EDR exports allow analysts to chart speed traces and braking points. Those traces can confirm or challenge visual impressions from the roadway. When paired with distance measurements, they anchor physics calculations with real-world inputs.
Drones For Safer, Faster Scene Capture
Uncrewed aerial systems help teams map large areas in minutes. A drone can fly a quick grid, capturing overlapping images that software turns into an accurate, scaled map. This is particularly useful on interstates or during multi-vehicle pileups where lanes must be reopened quickly.
Aerial views reveal patterns that are hard to see at ground level, like yaw arcs or fluid trails across several lanes. Pilots can fly a second pass at a lower altitude for close-ups of crush zones or guardrail strikes. Operators log flight metadata so each image ties back to a time and location.
Many agencies set standard flight plans for common crash types. That keeps data consistent across cases and simplifies courtroom explanations. It also helps less experienced pilots hit the right coverage on the first try.
Photogrammetry And 3D Scene Models
Photogrammetry software stitches hundreds of overlapping photos into a textured 3D model. Investigators can then measure distances, angles, and heights inside that model – without returning to the road. The model preserves context, showing how debris relates to lane lines, curbs, or sight obstructions.
Because the model is scaled, teams can re-check calculations months later. If a dispute arises over a measurement, the 3D scene is the single source of truth. That transparency is useful when multiple experts review the same site.
H3 sub-models can focus on key areas like an impact zone or a brake mark path. Those cutouts keep presentations tight for judges and juries. They speed up collaboration when engineers, medical experts, and attorneys each need different details.
Laser Scanners And LiDAR Point Clouds
Tripod-mounted laser scanners sweep the scene with millions of points to form a high-resolution point cloud. Each scan captures surfaces of vehicles, road texture, and nearby structures. When scans are registered together, the result is a dense, measurable 3D dataset.
Point clouds help with tight tolerances, like matching bumper heights or measuring subtle roadway crowns. They are great for visibility studies. Analysts can place a virtual camera at driver-eye height to evaluate sight lines and obstructions.
- Common uses include exact crush profiling, lane geometry, and grade changes
- Point clouds align with photogrammetry to fill gaps and validate accuracy
- Exports feed CAD tools for animations and physics simulations
Dashcams, Bystander Video, And Time Sync
Video is a timeline gift. Dashcams, security cameras, and bystander phones can capture pre-impact behavior, signal states, and post-crash movements. The challenge is locating, collecting, and authenticating those clips before they are overwritten.
Teams build a time ladder by syncing video timestamps with known references, like 911 call logs or cellular network time. That lets analysts compare frames to EDR events and skid mark starts. A frame-by-frame review can show when brake lights activate or a head turns toward a hazard.
Chain of custody matters for video. Investigators record where a clip came from, who handled it, and how it was stored. Clear documentation reduces fights over authenticity later.
Smartphone Sensors And On-Device Crash Detection
Phones carry accelerometers, gyroscopes, GPS, and barometers. Some apps and native features flag sudden deceleration and prompt emergency calls. While these alerts are not formal crash logs, they can provide helpful timing and location context.
If users opt in, telematics programs store trip data like speed and harsh braking. Those logs sometimes support or challenge claims about driver behavior. Investigators still need to verify accuracy and sampling rates before relying on them.
Privacy is key. Consent and retention limits should be honored, and access should be narrowly tailored to what the case requires. Narrow scope builds trust and keeps focus on facts.
Weather, Lighting, And Visibility Studies
Light and weather change fast, so documentation starts early. Photos note sun angles, glare, and shadow lines at the same time of day. Weather logs show precipitation, temperature, and wind, which can affect road friction and stopping distance.
With 3D models, analysts simulate driver-eye views along approach paths. They test whether a sign, pillar, or parked vehicle blocked a view at a crossing pedestrian. If a hill or curve limits sight distance, that becomes a quantifiable constraint.
Visibility studies are shared with clear captions and scales. Simple graphics beat dense math for many audiences. The principle is to make each conclusion trace back to a measurable fact.
Working With Multidisciplinary Teams
Crash work is a team sport. Reconstructionists, human factors experts, mechanical engineers, and medical professionals each add a lens. Technology creates a common workspace where each expert can test ideas against the same dataset.
Clear roles prevent overlap and confusion. One person manages drone data, another validates scanner registration, and a third owns video timelines. Checklists keep the workflow predictable across cases.
- Define owners for each data source and deliverable
- Set naming conventions and version control at the start
- Schedule peer reviews before final opinions lock in
Accident scenes are stressful and messy, yet technology helps bring order without slowing traffic or risking more harm. When teams capture reliable data, explain it clearly, and preserve it well, the facts can speak for themselves. That is how investigations serve safety, fairness, and the people who need answers.