


Intel Core i9 14900K Review
Intel Core i9 14900K – The New King Of CPUs?
The day is finally upon us, Intel’s new CPUs are finally here! While we don’t have a whole stack of motherboard reviews for you, we do have the top CPU, the 14900K. This is going to be their new top consumer CPU and for good reason. As we will soon see in the testing and benchmarks below, this is one hell of a CPU and while it comes with the price tag to match, if you want the best of the best, this is it.
Intel has announced the pricing will stay in line so if this is the case, the 14900K will come in at $589. When you consider what it has to offer, this really isn’t that bad for a 24-core CPU with a max turbo frequency of 6GHZ! We all also know that Intel CPUs have more compatibility with higher-frequency RAM so you will be able to get every drop of performance you can, for a price of course.
The K in the naming means that this chip is unlocked. Unlocked means that this CPU can be overclocked and while we won’t see how far we can push it in this review, please know that it is at least an option. In this day and age, the average user does not need to overclock as components already offer so much performance. However, should you want to overclock, there are a number of programs and guides out there that will help you with this.
Utilizing the LGA1700 socket, the Intel Core I9 14900K is pretty impressive on paper, but will it hold up to real work testing? Let’s find out!
Intel Core i9 14900K Specifications
Total Cores
24
# of Performance-cores
8
# of Efficient-cores
16
Total Threads
32
Max Turbo Frequency
6 GHz
Intel® Thermal Velocity Boost Frequency
6 GHz
Intel® Turbo Boost Max Technology 3.0 Frequency ‡
5.8 GHz
Performance-core Max Turbo Frequency
5.6 GHz
Efficient-core Max Turbo Frequency
4.4 GHz
Performance-core Base Frequency
3.2 GHz
Efficient-core Base Frequency
2.4 GHz
Cache
36 MB Intel® Smart Cache
Total L2 Cache
32 MB
Processor Base Power
125 W
Maximum Turbo Power
253 W
Closer Look
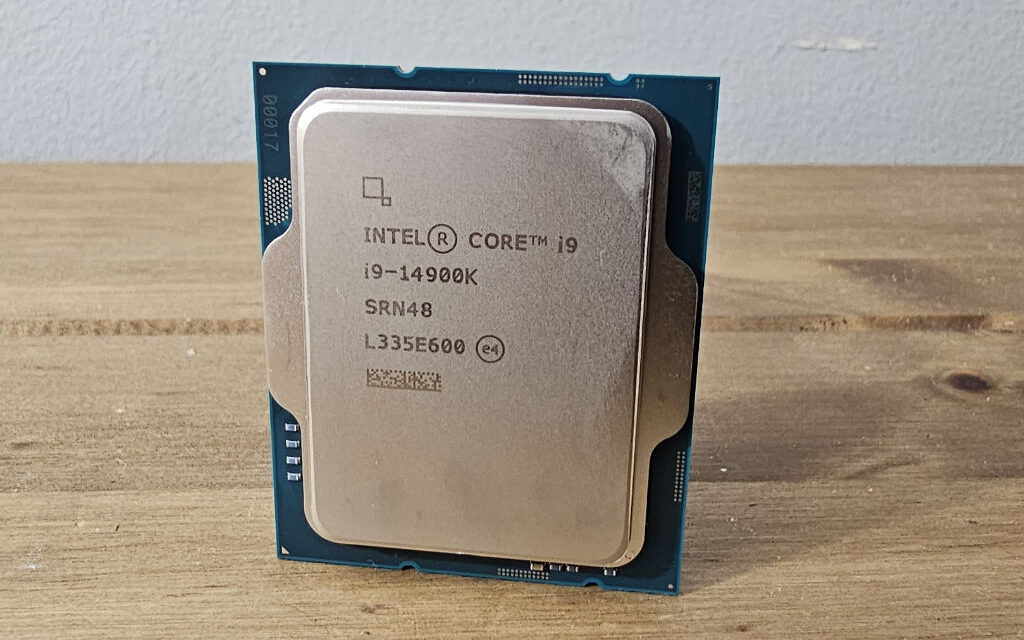
We were lucky enough to get our hands on a bare CPU, no box or anything so you will have to forgive us for not having loads of images! There really isn’t much to look at as it is just a CPU. On the front/top we have the Intel Core i9 14900K in writing.

As has been the case for as far as I can remember, the bottom side of the Intel Core i9 14900K is pinless. As always, the pins are found in the motherboard. Performance aside, this used to be one of the main differences between Intel and AMD CPUs but now, even AMD has gone for the LGA approach to their CPUs.

Testing Methodology
How We Test
As hardware continues to evolve, so do our testing methods. This includes using new hardware, software, and of course, tools to make sure we are testing things to the best of our ability. When testing similar products like motherboards, we use the same methods and tests so we can replicate comparable results as best as possible.
Test System
- Motherboard – ASUS TUF GAMING Z790 GAMING – WIFI $204.99/£239.99 ( Amazon / Overclockers UK / SCAN )
- CPU – Intel 14900K ( Amazon / Overclockers UK / SCAN )
- Memory – Corsair Vengeance 32GB (16×2) 6000 MHz CL36 ( Amazon / Overclockers UK / SCAN )
- Graphics – PowerColor AMD Radeon RX 6800 16GB ( Amazon / Overclockers UK / SCAN )
- SSD – Verbatim Vi7000G ( Amazon / Overclockers UK / SCAN )
- Power Supply – Thermaltake TOUGHPOWER GF3 1200W ( Amazon / Overclockers UK / SCAN )
Software/Web Based
- 3DMARK – Timespy / FireStrike Extreme / CPU Power
- AIDA64 – Read/Write/Copy – Latency – CPU Queen
- Cinebench R23
- Super Pi
- Google Octane 2.0
- Mozilla Kraken 1.1
- WebXPRT 4

Power Consumption
We currently measure power consumption both while Idle and at Load during a Cinebench R23 run.
VRM Temperatures
Similar to power Consumption, we read VRM Temperatures at both Idle and Load using a digital thermometer with Type K Thermocouples.
Games
For now, we test Tomb Raider’s inbuilt benchmark to give some sort of indication as to gaming performance. For Doom and Dirt 5, we run the game and use CapeFrameX to capture the FPS. In the future, we will look to add more games to our testing.
Benchmarks and Performance
3DMARK – Timespy
3DMark Time Spy is a DirectX 12 benchmark test for Windows 10 gaming PCs. Time Spy is one of the first DirectX 12 apps to be built the right way from the ground up to fully realize the performance gains that the new API offers.
With its pure DirectX 12 engine, which supports new API features like asynchronous computing, explicit multi-adapter, and multi-threading, Time Spy is the ideal test for benchmarking the latest graphics cards.

In our first benchmark, we can see that the 14900K is reigning supreme!
3DMARK – Firestrike Extreme
3DMark Fire Strike Extreme is designed for multi-GPU systems and future hardware generations.
In addition to raising the rendering resolution, additional visual quality improvements increase the rendering load to ensure accurate performance measurements for truly extreme hardware setups.

Again the 14900K is top of the FireStrike Extreme charts. However, this time, the 13700KF and 7800X3D aren’t that far behind.
3DMARK – CPU Profiles
The 3DMark CPU Profile introduces a new approach to CPU benchmarking. Instead of producing a single number, the 3DMark CPU Profile shows you how CPU performance scales with the number of cores and threads used. The CPU Profile has six tests that use 1, 2, 4, 8, 16 or the maximum number of available threads. These tests help you benchmark and compare CPU performance for gaming, overclocking, and other scenarios.

If we ended the review here and only looked at 3DMark results, the Intel Core I9 14900K would blow the competition out of the water! Luckily, we have some more results so let’s see how things go in a few more tests.
Cinebench R23
Cinebench is a real-world cross-platform test suite that evaluates your computer’s hardware capabilities. Improvements to Cinebench Release 23 reflect the overall advancements to CPU and rendering technology in recent years, providing a more accurate measurement of Cinema 4D’s ability to take advantage of multiple CPU cores and modern processor features available to the average user.

In Cinebench R23, the 14900K is still the top CPU in both single and multi-threaded runs.
AIDA 64 – Read/Write/Copy
AIDA64 Engineer has a hardware detection engine unrivaled in its class. It provides detailed information about installed software and offers diagnostic functions and support for overclocking. As it is monitoring sensors in real-time, it can gather accurate voltage, temperature, and fan speed readings, while its diagnostic functions help detect and prevent hardware issues. It also offers a couple of benchmarks for measuring the performance of individual hardware components or the whole system. It is compatible with all 32-bit and 64-bit Windows editions, including Windows 11 and Windows Server 2022

We used the same kit of Corsair memory for all four of the above CPU tests and benchmarks. Look at the difference the 14900K offers, especially over the 7800X3D which is one of the current best gaming CPUs on the market. Intel has always had better memory utilization, especially at higher frequencies and this just shows it!
AIDA64 Latency

While 25 ns may not be a lot in real work time, it sure looks like a massive difference on charts and graphs. The Intel Core i9 14900K is still claiming that stop sport so far in every test we have run!
AIDA64 – CPU Queen

Again the 14900K is top of the charts! In fairness, it is the most expensive CPU we had for these comparisons by some margin. It has an MSRP of almost $200 than the 13700 and 7800X3D CPUs so we would hope that it would perform better.
Google Octane 2.0
Octane 2.0 is a benchmark developed by Google that measures JavaScript performance. A higher Octane 2.0 score correlates to faster page load times.

We wanted to add some web-based benchmarks to the mix as well and as you can imagine, the 14900K has dominated these as well.
Mozilla Kraken 1.1
Kraken is a JavaScript performance benchmark created by Mozilla that measures the speed of several different test cases extracted from real-world applications and libraries.

Mozilla Kraken is another web-based benchmark that offers its results in milliseconds so the lower the number, the better. The 14900K is almost 100ms faster than the AMD 7800X3D.
WebXPRT 4
See how your Web-browsing experience measures up. WebXPRT 4 is a browser benchmark that compares the performance of almost any web-enabled device.

One last web benchmark by way of WebXPRT 4. The margins are a bit closer this time but the 14900K still takes the top spot!
Power Consumption
Power Consumption is measured by plugging the PSU power cable into a digital meter which is then plugged into a mains socket. This gives live readings of the wattage being used.
Idle – The PC is turned on and left for 10 min then the wattage is read.
Load- Cinebench R23 is used for 10min and the wattage is read just before the testing ends.

Here is where things finally get a little more interesting. In our tests, the 7800X3D had a higher idle power consumption than the 14900K. However, at load in Cinebench R23 the 14900K used over double the power. It wasn’t until we loaded Dirt 5 that the 7800X3D really started to use its power, but the 14900K was still more power-hungry.
VRM Temperature
These results are more for fun, though we do use the same method every time.
The VRM Temperature is read using a digital thermometer with Type K Thermocouples.
Idle – The PC is turned on and left for 10 min then the temperature is read.
Load- Cinebench R23 is used for 10min and the temperature is read just before the testing ends.

Please take these results with a pinch of salt. I simply place two Type-K thermocouples directly on the VRMs and monitor the temps. While they should be fairly accurate we are only using a personal digital thermometer with type-k thermocouples.
Tomb Raider
Tomb Raider explores the intense origin story of Lara Croft and her ascent from a young woman to a hardened survivor.

This is where things finally get a bit more interesting. Now, I know some will ask why test with Tomb Raider, and the answer is simple, it gives very similar results when using the same GPU as you can see above. However, we can also see the CPU plays a tiny part and in this case, the 7800X3D has taken the top sport and offers 2.5 more FPS than the 14900K.
Doom Eternal
Hell’s armies have invaded Earth. Become the Slayer in an epic single-player campaign to conquer demons across dimensions and stop the final destruction of humanity.

It seems that when it comes to gaming, the 7800X3D is still the king and in Doom Eternal, the 14900K came up short by 8FPS VS the 7800X3d.
Dirt 5
DIRT 5 is a fun, amplified, off-road arcade racing experience created by Codemasters. Blaze a trail on routes across the world, covering gravel, ice, snow, and sand, with a roster of cars ranging from rally icons to trucks, to GT heroes.

Ending our gaming tests with Dirt 5 and again, the 7800X3D just barely nudged out the 14900K by 2.3FPS. This isn’t a massive deal but depending on your needs, something to keep in mind.
Final Words
There we have it folks, the wind up and the pitch! It looks like a home run all around for the Intel Core i9 14900K in terms of performance. While the 7800X3d may have pushed a couple of FPS more in gaming results, it doesn’t make up for the astonishing performance the 14900K has over it in the rest of the benchmarks. Sure, if you are only worried about gaming performance the 7800X3d looks much more enticing. However, if you plan on doing almost anything else, the extra couple of FPS in games is no longer worth it as the 14900K offers much better performance literally everything else.
Of course, the 14900K is going to come with a higher price tag, and in our testing, it is well worth it. Better performance, better RAM compatibility, especially at high frequencies, and 24 cores make it look like a very appealing offering.
The 8 P-Cores are coming with a base frequency of 3.2GHz and a turbo frequency of 5.6GHz. For the 16 E-cores, we have a 2.4GHz base clock and a turbo of 4.4 GHz. Of course, Intel’s Turbo Boost Max Technology and Velocity Boost Frequencies help to push these numbers even further depending on workload and temperature.
Value
There is no denying that $589 is quite a price tag for a new CPU, especially if you need a new motherboard and memory to go with it. However, Intel has kept pricing the same as they did with their 13th Gen processors, and with that in mind, this makes the 14900K a good value in my opinion.
Intel could have easily added an extra tax onto their newest generation of processors if they had wanted to. Keeping the prices the same for multiple generations is a great gesture on Intel’s part, especially in this day and age when everyone else is just looking for any excuse to raise their prices.

Is It Worth It?
If you want the best of the best when it comes to consumer CPUs, then yes it is well worth it. The 14900K is hands down the king of the CPU world when it comes to benchmarks and testing results. While it may be a couple of FPS behind the competition in games, it is just that, only a couple of FPS. For those who are only interested in gaming, then sure you can save some money and get a CPU that offers a bit better FPS. However, the results are negligible and if you plan on doing anything else, like streaming, content creation, editing, or more; the 14900K is the CPU you will want.
The 14900K drops today and there is no doubt a lot of people will be ordering one so they can make sure they have the best performance available. As we expected, Intel knocked it out of the park again and continues to be the KING of Consumer CPUs.


